


Organizational Information
Finances
Our Supporters and Partners
Cadasta’s mission, strategy, and finances are guided by the leadership and expertise of a volunteer Board of Directors, who are leading global experts in their respective domains.
Institutional Donors
- Founder’s Pledge
- IRS COVID Fund
- Jacobs Futura Foundation
- John Templeton Foundation
- Karen Environmental and Social Action Network (KESAN)
- Landesa
- Lantmäteriet
- Livelihood Impact Fund
- Martin Family Foundation
- Millennium Challenge Account (MCA)
- Millennium Challenge Corporation (MCC)
- Nelson S. Talbott Foundation
- Swedish Postcode Lottery Foundation/Svenska Postkodlotteriets Stiftelse
- Tenure Facility
- Habitat for Humanity International (HFHI)
- Rights and Resources Initiative (RRI)
- Rising Tide Foundation
- Talbott Family Foundation
- UK Foreign, Commonwealth and Development Office (FCDO)
Individual Donors
- Albert Momo
- Alison Edwards
- Amy Coughenour Betancourt
- Angela Coughenour
- Anne Rakunas
- Boris Zamyatin
- Brian Brock
- Chris Locke
- Christopher Vincent
- Claire Buxton
- Deborah Coughenour
- Ede Ijjasz-Vasquez
- Elizabeth and Frank Blake
- Francis and Christine Martin Family Foundation
- Frank Pichel
- George Yashon Ombado
- Harriet R Congdon
- Jackie DeCarlo
- Janis VonQualen
- John Gillespie
- Juliet Ezechie
- K Kingston
- Kelly Liang
- Laura Bierema
- Leslie Weiner-Leandro
- Maria Marealle
- Maria Pia Hernandez
- Mary Beth Adams
- Megan Carnell
- Megan Wenrich
- Michael Baker
- Minna Jia
- Molly McGettrick
- Munehiko Joya
- Sarah Crozier
- Stephen Shannon
- Tosca van Vijfeijken
- William Abrams
Partners
Implementing Partners
Implementing partners that work directly with communities and governments.
- Action Research in Community Health-Vahini (ARCH-Vahini) | India
- Association of Saamaka Traditional Authorities (VSG) | Suriname
- Cambodian Indigenous Peoples Alliance (CIPA) | Cambodia
- COLANDEF Land and Property Rights | Ghana
- Confederación de las Nacionalidades Indígenas de la Amazonía Ecuatoriana (CONFENIAE) | Ecuador
- Fundación para el Desarrollo en Justicia y Paz (FUNDAPAZ) | Argentina
- GeoIndígena | Panama
- Habitat for Humanity International | The Bahamas, Barbados, Trinidad and Tobago, Bolivia, Colombia, Ecuador, Guatemala, Mexico, Nicaragua, Peru, El Salvador, Honduras, Dominican Republic.
- Julian Cho Society (JCS) | Belize
- Karen Environmental and Social Action Network (KESAN) | Myanmar
- Landesa | Rwanda
- Realm of Nature Based Actions (RNBA) | India
- Solidarité pour la Promotion des Femmes Autochtones (SPFA) | Democratic Republic of the Congo
- Ujamaa Community Resource Team (UCRT) | Tanzania
- Ujamaa Foundation | Uganda
Strategic, Advisory & Research Partners
Partner organizations that support systems-level change, advisory services, research, and shared data infrastructure.
- Global Land Alliance | Malawi
- International Land and Forest Tenure Facility (Tenure Facility) | Global
- Rights and Resources Initiative (RRI) | Global
- United States Geological Survey (USGS) | Guyana
The People Behind Cadasta
Cadasta Team
Cadasta’s team of land and development experts, GIS and technology specialists, and trainers during 2025:
Executive Team
- Amy Coughenour Betancourt, President & Chief Executive Officer
- Anthony Piaskowy, Senior Director of Operations & Program Impact
- Carolina Reynoso Pieters, Senior Director, Global Programs
- Heidi Burgess, Senior Director of Philanthropy & Strategic Partnership
- John Torres, Senior Director of Communications
- Kelly Liang, Senior Director of Finance
- Marco Taboada, Technical Manager
Operations
- Boris Zamyatin, Controller
- Jean Carla Costas, Operations Coordinator
- Kelly Liang, Senior Director of Finance
- Minna Jia, Project Finance Analyst (through July 2025)
Programs
- David Palomino, Program Specialist
- Diana Kyalo, Program Specialist for East Africa
- Esaie Dufitimana, Program Specialist
- Jean-Marc Placide, Program Manager (through April 2025)
- Leah Kellenberger, Program Manager
- Mickey Tennis, Program Assistant
- Oscar Kamuhinda, Field Manager (since April 2025)
- Pano Skrivanos, Senior Manager for Community Land and Climate
- Samuel Mboh, Project Specialist for West and Central Africa
- Theodomir Mugiraneza, GIS Specialist at Tenure Facility (through April 2025)
- Wambayi Wabwire, Land Administration Advisor
Technology
- Abid Hira, GIS & Program Specialist
- Deborah Haggith Jepkoech, Technical Consultant
- Juan Pablo Soliz Molina, Technology Director (through February 2025)
- Marcelo Landivar, GIS Specialist
- Ricardo Espinosa, GIS Program Specialist
- Theodomir Mugiraneza, GIS Specialist at Tenure Facility (through April 2025)
Communications & Impact
- Madaleine Weber, Senior Communications Advisor
- Sydney McKenney, Communications & Design Manager (through May 2025)
Business Development
- Caroline Moh, Senior Director of Business Development
- Rae Dinardo, Proposal and Technical Writer
Board of Directors
Cadasta’s mission, strategy, and finances are guided by the leadership and expertise of a volunteer Board of Directors, who are leading global experts in their respective domains.
Officers
- Albert H. Anoubon Momo – Board Chair; Co-Founder and CEO, GeoDEV International
- Juliet Ezechie – Vice Chair; Director, Ordnance Survey International
- Munehiko Joya – Board Treasurer; President, AGIS (Associazione Giapponese per l’Istruzione Scolastica)
- Maria Marealle – Board Secretary; Chief Land Officer, African Development Bank (term started June 2024)
Directors
- Cristina Coc – Founder, Julian Cho Society; Co-leader, Maya Leaders Alliance (MLA); and elected spokesperson, Toledo Alcaldes Association
- Rohini Chaturvedi – Strategy Advisor and Independent Consultant
- Ana Teresa Fuzzo De Lima – Partnerships Lead, Accountability Framework Initiative, Rainforest Alliance
- Ede Ijjasz-Vasquez – Senior Non-Resident Fellow, Brookings Institution; Senior Advisor, Global Center on Adaptation
- Chris Locke – EVP & MD, Internet Society Foundation
- María Pía Hernández Palacios – Regional Manager, Mesoamerican Territorial Fund
- Megan Wenrich – Head of Capital Formation, All Aboard Fund
- Chris Penrose Buckley – Senior Adviser and Land Policy Lead, Foreign, Commonwealth & Development Office (FCDO), UK
Financials
Funds
Org Functions
Revenue
Financial Position
Activities
Cash Flow
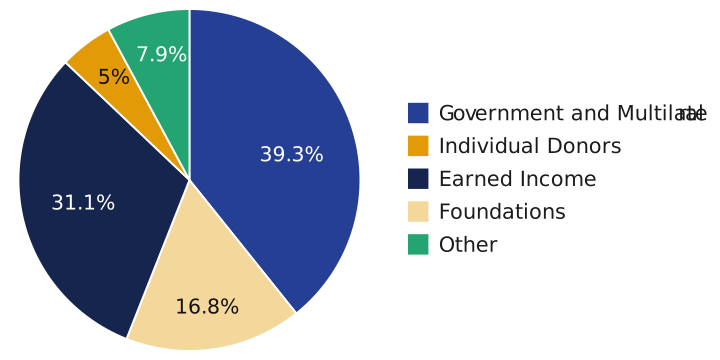
| Donor support | 2025 | 2024 | 2023 | % of total | 2022 | % of total | 2021 | % of total | 2020 | % of total |
|---|---|---|---|---|---|---|---|---|---|---|
| Government and Multilateral | $862,427 | $4,243,754 | $3,165,818 | 80.2% | $822,172 | 62.1% | $649,850 | 16.1% | $1,581,370 | 47.9% |
| Foundations | $360,353 | $10,000 | $290,000 | 7.3% | $200,000 | 15.1% | $2,868,485 | 70.9% | $1,632,141 | 49.5% |
| Earned income | $668,638 | $484,881 | $336,426 | 8.5% | $300,115 | 22.7% | $169,620 | 4.2% | $51,563 | 1.6% |
| Individual donors | $108,292 | $101,769 | $152,614 | 3.9% | $1,952 | 0.1% | $360,291 | 8.9% | $31,050 | 0.9% |
| Other | $169,486 | $123,396 | $3,057 | 0.1% | $— | 0.0% | $83 | 0.0% | $2,380 | 0.1% |
| Total | $2,169,197 | $4,963,801 | $3,947,915 | 100.0% | $1,324,238 | 100.0% | $4,048,330 | 100.0% | $3,298,504 | 100.0% |
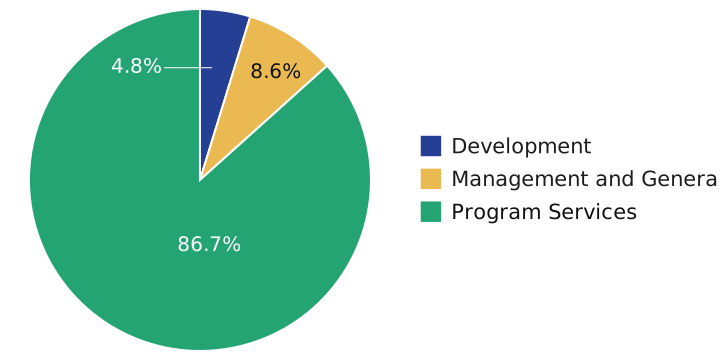
| Function types — expenses | 2025 | % of total | 2024 | % of total | 2023 | % of total | 2022 | % of total | 2021 | % of total | 2020 | % of total | 2019 | % of total | 2018 | % of total | 2017 | % of total | 2016 | % of total |
|---|---|---|---|---|---|---|---|---|---|---|---|---|---|---|---|---|---|---|---|---|
| Program services | $6,327,625 | 86.71% | $9,514,658 | 97.72% | $8,206,430 | 96.13% | $7,026,637 | 90.9% | $6,583,226 | 89.5% | $6,760,486 | 89.6% | $1,609,303 | 69.5% | $1,052,798 | 68.6% | $1,309,780 | 74.2% | $1,362,253 | 78.2% |
| Management and general | $622,838 | 8.54% | $149,192 | 1.53% | $224,071 | 2.62% | $493,636 | 6.4% | $329,696 | 4.5% | $383,658 | 5.1% | $519,943 | 22.5% | $355,989 | 23.2% | $329,189 | 18.7% | $253,839 | 14.6% |
| Development | $340,050 | 4.66% | $43,292 | 0.44% | $48,750 | 0.57% | $4,782 | 0.1% | $53,324 | 0.7% | $261,637 | 3.5% | $172,382 | 7.4% | $115,921 | 7.5% | $111,852 | 6.3% | $116,656 | 6.7% |
| Fundraising | $6,864 | 0.09% | $29,490 | 0.30% | $57,488 | 0.67% | $203,839 | 2.6% | $387,861 | 5.3% | $141,305 | 1.9% | $13,863 | 0.6% | $10,888 | 0.7% | $13,918 | 0.8% | $9,678 | 0.6% |
| Total | $7,297,377 | 100.00% | $9,736,632 | 100.00% | $8,536,739 | 100.00% | $7,728,894 | 100.0% | $7,354,107 | 100.0% | $7,547,086 | 100.0% | $2,315,491 | 100.0% | $1,535,596 | 100.0% | $1,764,739 | 100.0% | $1,742,426 | 100.0% |
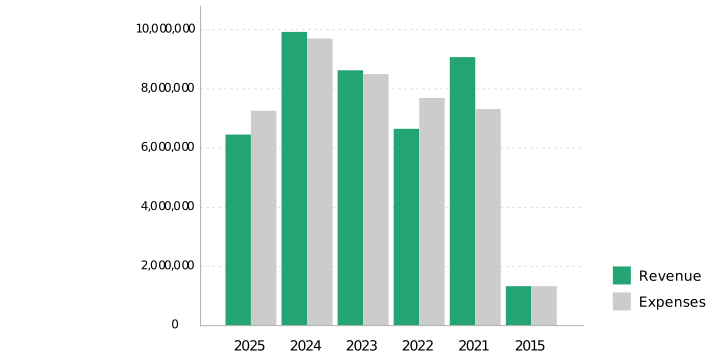
| Revenue and expense trends | 2025 | 2024 | 2023 | 2022 | 2021 | 2020 | 2019 | 2018 | 2017 | 2016 | 2015 |
|---|---|---|---|---|---|---|---|---|---|---|---|
| Revenue | $6,491,622 | $9,961,302 | $8,664,497 | $6,685,526 | $9,108,573 | $8,418,740 | $3,139,784 | $1,580,856 | $1,773,819 | $1,744,137 | $1,366,812 |
| Expenses | $7,297,377 | $9,736,632 | $8,536,739 | $7,728,894 | $7,354,107 | $7,547,086 | $2,315,491 | $1,535,596 | $1,764,739 | $1,742,426 | $1,365,707 |
| 2025 | 2024 | 2023 | 2022 | 2021 | 2020 | 2019 | 2018 | 2017 | |
|---|---|---|---|---|---|---|---|---|---|
| Assets | |||||||||
| Bank accounts & liquid assets | |||||||||
| M&T Operating | — | — | — | — | — | — | — | $10,668 | $10,668 |
| M&T Petty Cash | — | — | — | — | — | — | — | $2,664 | $2,664 |
| M&T Savings | — | — | — | — | — | — | — | $190,802 | $190,802 |
| Wells Fargo Credit Card Security | — | — | — | — | — | — | — | $14,115 | $14,115 |
| Cash and Cash Equivalents | $2,267,638 | $2,847,656 | $2,708,648 | $2,312,346 | $3,588,368 | $1,675,131 | $1,039,947 | $304,017 | $435,033 |
| Accounts Receivable | $5,000 | $105,811 | $265,268 | $275,054 | $59,099 | $147,089 | $58,957 | $15,479 | $7,312 |
| Deposits | |||||||||
| Temporarily Restricted Cash | — | — | — | — | — | — | — | $25,000 | $25,000 |
| Prepaid Insurance | — | — | — | — | — | — | — | $3,957 | $3,957 |
| Deposits | — | — | — | — | — | — | — | $2,988 | $2,988 |
| Prepaid Expenses, Deposits, and Other | $27,428 | $39,888 | $50,938 | $28,631 | $25,219 | $34,772 | $26,399 | $26,574 | $16,418 |
| Fixed assets | |||||||||
| Equipment | — | — | — | — | — | — | — | $16,101 | $16,101 |
| Accumulated Depreciation | — | — | — | — | — | — | — | ($2,752) | ($2,752) |
| Property and Equipment, Net | $8,582 | $12,415 | $12,876 | $7,603 | $6,536 | $11,961 | $16,005 | $5,811 | $7,863 |
| Total Assets | $2,308,648 | $3,005,770 | $3,037,730 | $2,623,634 | $3,679,222 | $1,868,953 | $1,141,308 | $351,881 | $466,626 |
| Liabilities & Net Assets | |||||||||
| Liabilities | |||||||||
| Accounts payable detail | |||||||||
| Accounts Payable | — | — | — | — | — | — | — | $50,435 | $50,435 |
| Accounts Payable | $68,472 | $106,443 | $252,480 | $123,609 | $45,698 | $43,953 | $55,110 | $32,819 | $54,542 |
| Payroll related payables detail | |||||||||
| Wages Payable | — | — | — | — | — | — | — | $44,115 | $44,115 |
| Tax Withholding | — | — | — | — | — | — | — | $23,124 | $23,124 |
| Accrued Salaries and Related Benefits | $52,553 | $56,080 | $52,273 | $35,824 | $125,955 | $71,897 | $90,819 | $101,781 | $76,260 |
| Refundable Advance | $176,749 | $26,618 | $141,018 | — | — | — | $90,819 | $101,781 | $76,260 |
| Total Liabilities | $297,774 | $189,141 | $445,771 | $159,433 | $171,653 | $115,850 | $145,929 | $134,600 | $130,802 |
| Net Assets | |||||||||
| Without Donor Restrictions | $2,010,874 | $2,816,629 | $2,591,959 | $2,464,201 | $3,507,569 | $201,491 | $881,449 | $57,156 | $11,896 |
| With Donor Restrictions | $0 | $0 | $0 | $0 | $0 | $1,551,612 | $113,930 | $160,125 | $323,928 |
| Total Net Assets | $2,010,874 | $2,816,629 | $2,591,959 | $2,464,201 | $3,507,569 | $1,753,103 | $995,379 | $217,281 | $335,824 |
| Total Liabilities & Net Assets | $2,308,648 | $3,005,770 | $3,037,730 | $2,623,634 | $3,679,222 | $1,868,953 | $1,141,308 | $351,881 | $466,626 |
| Supplementary Data | |||||||||
| Current Assets | $2,300,066 | $2,993,355 | $3,024,854 | $2,616,031 | $3,672,686 | $1,856,992 | $1,125,303 | $346,070 | $458,763 |
| Current Liabilities | $297,774 | $189,141 | $445,771 | $159,433 | $171,653 | $115,850 | $145,929 | $134,600 | $130,802 |
| Current Ratio | 7.72 | 15.83 | 6.79 | 16.41 | 21.40 | 16.03 | 7.71 | 2.57 | 3.51 |
| Changes in Net Assets | ($805,755) | $224,670 | $127,758 | ($1,043,368) | $1,754,466 | $871,654 | $793,601 | ($118,543) | ($75,028) |